People today want to see the same level of information on their boats that they can for their homes and cars. Onboard questions abound, like: How much water and fuel am I using? How is the engine performing? And how much power am I consuming while at anchor? Well, there are a number of technologies that are easier than ever to get your hands on, which can help an older boat be more connected, and a newer boat be even better integrated.
Most boats have a variety of different systems that are independent from one another, or simply aren’t connected in a way that would allow you to see trends or monitor things remotely. With some DIY spirit and elbow grease, and a few bits of technology, you can connect things together and end up with a very modern solution that allows active and accurate monitoring of lots of information—from on and off the boat—and potentially consolidated into a single, customized dashboard for easy use.
The process to get you there might seem technologically complicated, but if you take it one step at a time, it should be as accessible as any other boat project. And once you’ve done the work to set this system up, you may be surprised what you can learn about your boat. The basic principles are to: gather data, process the data through the open-source software Signal K, and then customize the specific information your boat is sending to the system utilizing plugins, dashboards, and alerts or alarms of your choosing.
Accessing the data
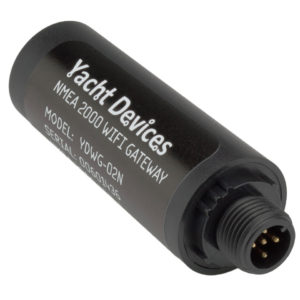
Getting access to the various info on your boat is usually the biggest challenge. This includes things like depth, wind speed, water tank levels, engine performance, and a wealth of other things your on-board instruments already track. If you have a NMEA 0183 or 2000 network, then you can use products like the NEMO Gateway from local company Rose Point Navigation Systems, or a similar product from Yacht Devices called the Wireless Gateway. Both can send streams of information out on a WiFi network from your boat devices.
Connecting these to one or more networks on your boat can allow you to see the data on your phone or tablet, which has been around for a while, but sending it to a dedicated computer will allow you to do even more with it, as you’ll see below, and is where the real power comes into play.
For older boats, engine information is one of the most requested things, and that requires installing an analog-to-digital engine instrument like the Actisense EMU-1. This connects to the wiring for your existing engine gauges and alarms, and turns that data into NMEA 2000 messages which can be displayed on chart plotters as well as sent to a dedicated computer.
Tanks are another common thing to connect to a network, usually using a pressure or ultrasonic sensor, or even an older floating sensor. Products exist from Yacht Devices, Maretron, and many other manufacturers to take these sources and put them on a network. Once connected, you can see the information from many places, and start to build a more accurate picture for things like water consumption and fuel burn.
If you are a bit more tech minded, you can even adapt your own sensors and devices to send their data to Signal K using fairly cheap solutions like Arduino. This requires a bit of DIY and background knowledge with software programming, but it can be a worthwhile investment to save a lot of money, and to share with the community.
Getting the data into Signal K
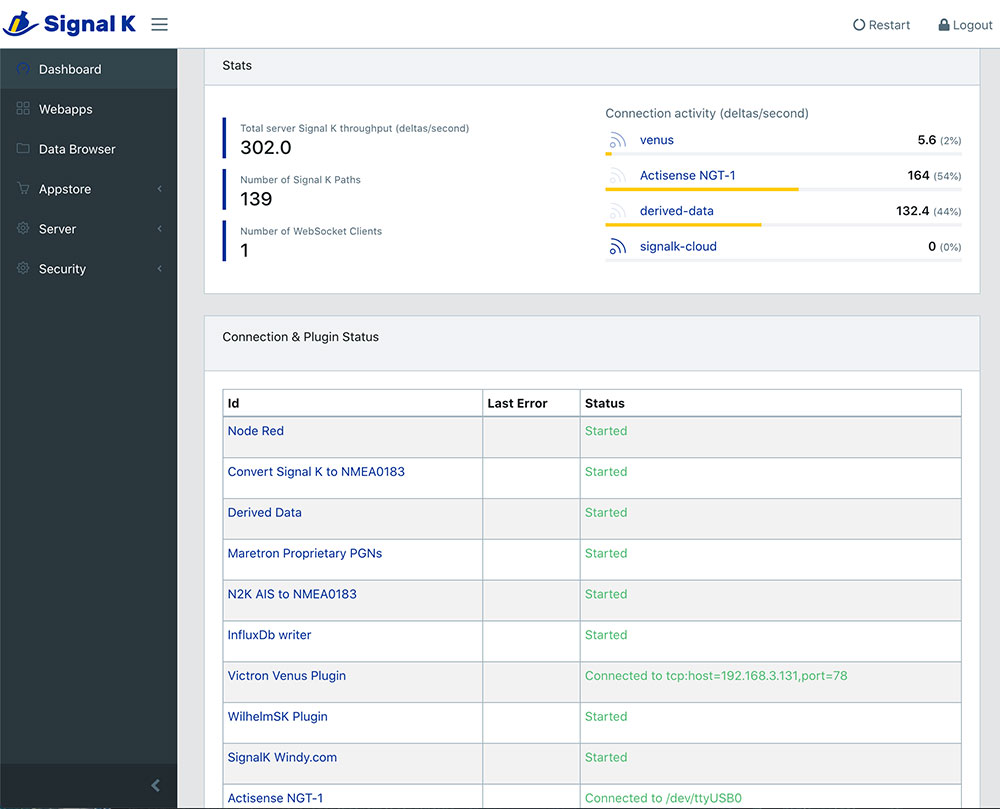
Once you have access to the various boat networks, it’s time to think about how you can take that information and do something with it. An open source software project that has been around for 5-plus years, Signal K’s mission is to be a free and open source universal marine data exchange format. Signal K will gather the data from your different sources and allow you to convert it, display it, and save it for longer term analysis.
To get started with Signal K, you’ll need a computer on which to run the software. You can use anything from a very inexpensive Raspberry Pi (retails for $69 and can be found for less), or run it on an existing computer that you have on board. It will run on pretty much any operating system, and is very easy to install. Once you have it installed, you’ll want to get your boat data into Signal K so you can start doing something with it. You can use one of the products mentioned earlier from Rose Point or Yacht Devices, or purchase a USB to NMEA 2000 network connector that will plug directly into your computer. This will allow your computer direct access to your on-board instruments.
Alerts and Automations
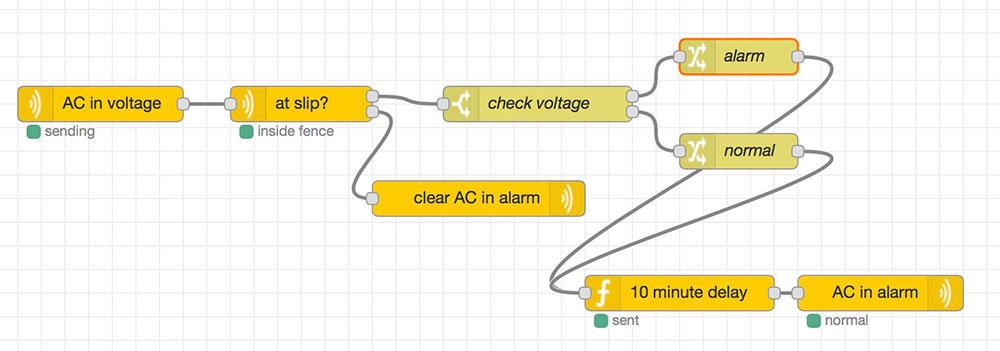
Once you have information in Signal K, you can use various plugins such as IFTTT (If This Then That) or Node-RED to watch for various conditions—such as high winds or number of bilge pump activations—and send you an email, text, or other notification, whether you are aboard or away.
You could even automate tasks, such as watching the AC power voltage, but only if your boat is in the slip, not while you are out underway. These features are available in a number of commercial products that cost many thousands of dollars to install, and have very limited functionality and choices, plus they usually require a yearly subscription. Having a computer monitoring everything and using automation is a powerful tool to help keep your boat safe. One thing to consider is the size and type of computer you are using. The Raspberry Pi is very conducive to use on boats because of its small size and comparatively low power usage. Using a bigger laptop or other computer could use more power overall, which may be a challenge with longer term cruising.
Dashboards
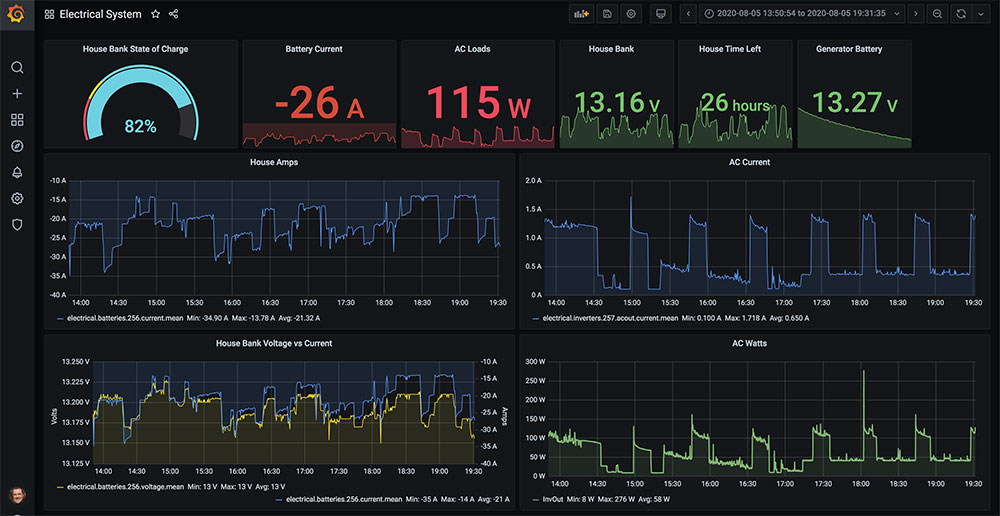
A little more advanced, but definitely worth the effort, is setting up dashboards for longer term data analysis.
Setting up the system to store the data in InfluxDB is only a few clicks of a plugin, and your data will be stored for later analysis. Now that the data is available, you can use another open-source software program called Grafana to create beautiful visualizations that you can use at anchor to keep tabs on your electrical system, or after a voyage to analyze engine performance.
It takes a little more effort to build the dashboards, but more and more people (including me!) are publishing how they did it, and the files that go along with it, so that you have a place to start.
Mobile / App Access
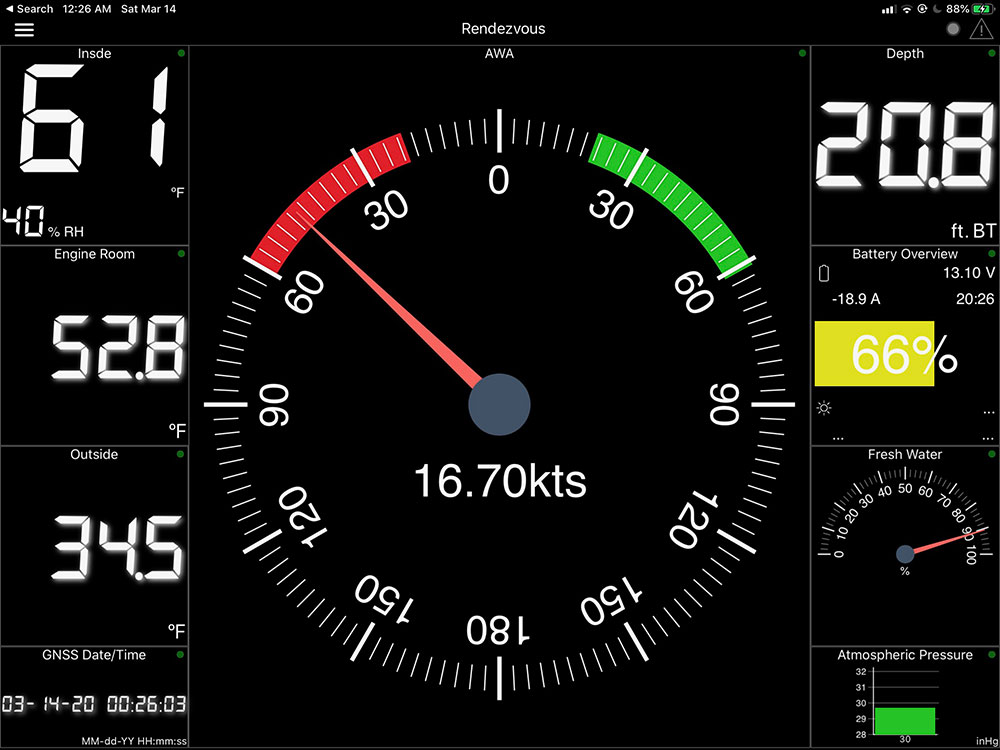
Another wonderful plugin is WilhelmSK, which allows you to access all of this data from an app available for iPhone and iPad devices. Not only is it completely customizable, but it can send you alarms and alerts, show maps and AIS targets, and be set up for night mode so you can keep tabs on things while in your stateroom. The biggest benefit is that it allows you to combine all of the different systems your computer is connected to and show them in one single application, rather than having to flip between apps.
Helping Others
Once you have a computer doing all of this, you can take some of the data and share it with others. A great way of doing this is to become a mobile AIS base station. You’re likely familiar with having AIS targets on your chartplotter, but you can also take that data from your network and send it to various AIS sharing services like MarineTraffic or AIShub. By doing this, you’re helping increase the accuracy of the maps that are produced with ships shown on them. You can do this with a few clicks in Signal K to set-up an AIS plugin.
Even More….
There are even more ways to use the information that you’ve uncovered. Plugins and features exist for things like controlling your Fusion radio, Raymarine autopilot, setting up a weather station that others can see on Windy.com and many other interesting things. The biggest challenge is getting the data into Signal K first, and spending a few minutes learning what your boat has that you might be able to see.
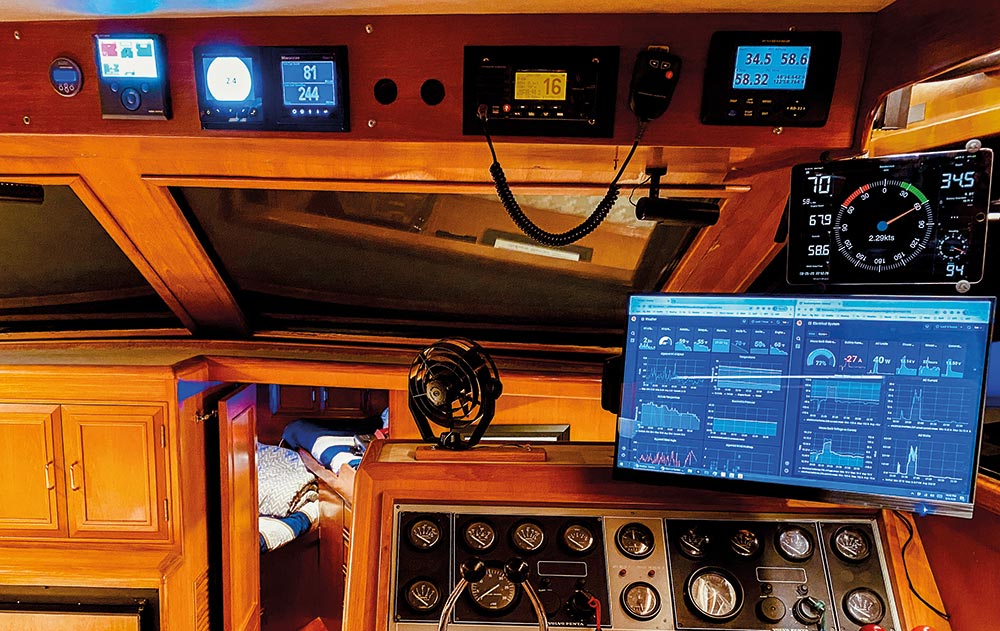
This is just one example of using products from Yacht Devices (NMEA 2000 0183) combined with an open source piece of software in Signal K, running on a tiny, power conscious Raspberry Pi that would allow amazing visibility into your boat both in real-time, and for analysis later.